Pipelines & integrations
I pull data from Google Cloud APIs, custom REST APIs, app databases, CSV files, sheets and forms, then land it cleanly in PostgreSQL or BigQuery.
Python · FastAPI · REST APIs · Google Cloud
Analytics Engineer · Data Analyst
I'm Tasnim, an analytics engineer and data analyst with four years across fintech, travel, B2B and civic data. I turn messy sources into trusted numbers and automate the reporting, so teams spend their time deciding, not compiling. Currently at Gozayaan.
I pull data from Google Cloud APIs, custom REST APIs, app databases, CSV files, sheets and forms, then land it cleanly in PostgreSQL or BigQuery.
Python · FastAPI · REST APIs · Google Cloud
I write star-schema marts, production SQL and data-quality rules, so every team counts customers, transactions and revenue the same way.
SQL · BigQuery · PostgreSQL · Snowflake
Any report or data handoff that repeats becomes a scheduled job. Python does the work and cron or n8n runs it, so nobody has to remember.
GitHub Actions · n8n · Apps Script
Cohorts, retention, CAC and LTV, funnels, pricing and revenue, delivered as dashboards people use on their own.
Metabase · Power BI · Looker · Mixpanel
If a report or data handoff happens on a schedule, it should run itself. I write the job in Python, schedule it on GitHub Actions or n8n, and deliver the output wherever people already look. I've used this pattern to retire hand-built daily reports and recurring data extracts.
Python · GitHub Actions · n8n · SQL · REST APIs
A few outcomes from the work above.
Reporting speed
5 → 1 day
Month-end reporting turnaround after I redesigned the process.
Gozayaan
Public impact
~5,700 affidavits
Candidate affidavits from four national elections, scraped, digitised and published in Transparency International Bangladesh's public "Know Your Candidate" dashboard for voters.
Transparency International Bangladesh
Breadth
15+ dashboards
Dashboards and reports across 6 business functions, built on a warehouse I designed from the ground up.
Riseup Labs
Time saved
8–10 hrs / week
0of a 40-hour week40h
Manual data collection replaced with automated pipelines and n8n workflows into PostgreSQL.
Riseup Labs
Decision speed
30% faster
Shorter decision cycles once teams had live dashboards instead of waiting on manual reports.
Riseup Labs
Marketing funnel
+5–8% conversion
Funnel and channel analysis that found where prospects dropped off, and flagged a paid campaign that wasn't paying back, which was then stopped.
Riseup Labs
Pick a bar to read what I did there.
Employer work is confidential, so most of these are personal projects. I redrew each chart from its notebook's real output.
Python · pandas
186,305 cleaned orders across 10 US cities. Where does revenue come from, and when?
SQL · MySQL
Fatality and infection rates by country from Our World in Data, using CTEs, joins and views.
WITH cte AS (
  SELECT location,
    MAX(CAST(total_deaths AS UNSIGNED)) AS deaths,
    MAX(CAST(total_cases  AS UNSIGNED)) AS cases
  FROM coviddeath
  WHERE continent IS NOT NULL
    AND location = 'bangladesh'
  GROUP BY location)
SELECT location,
  ROUND(deaths / cases * 100, 2) AS fatality_rate
FROM cte;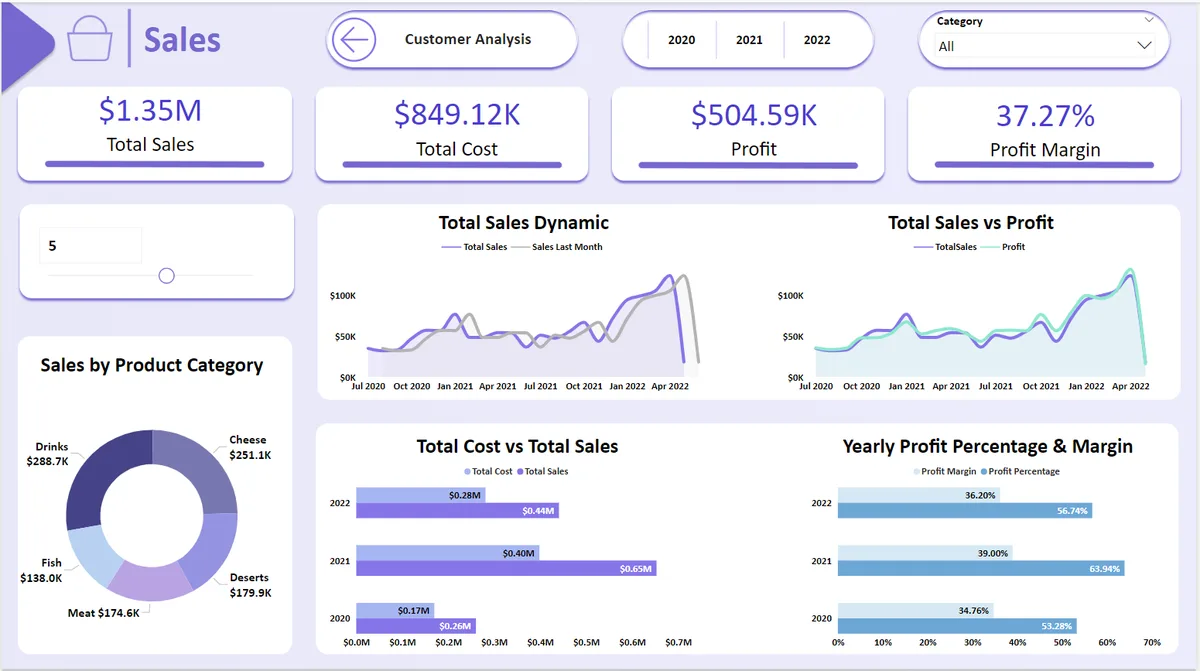
Power BI · DAX · data model
A two-page report (sales and customers) on a modelled star schema, with month-over-month DAX measures and slicers for year and category.
Repository ↗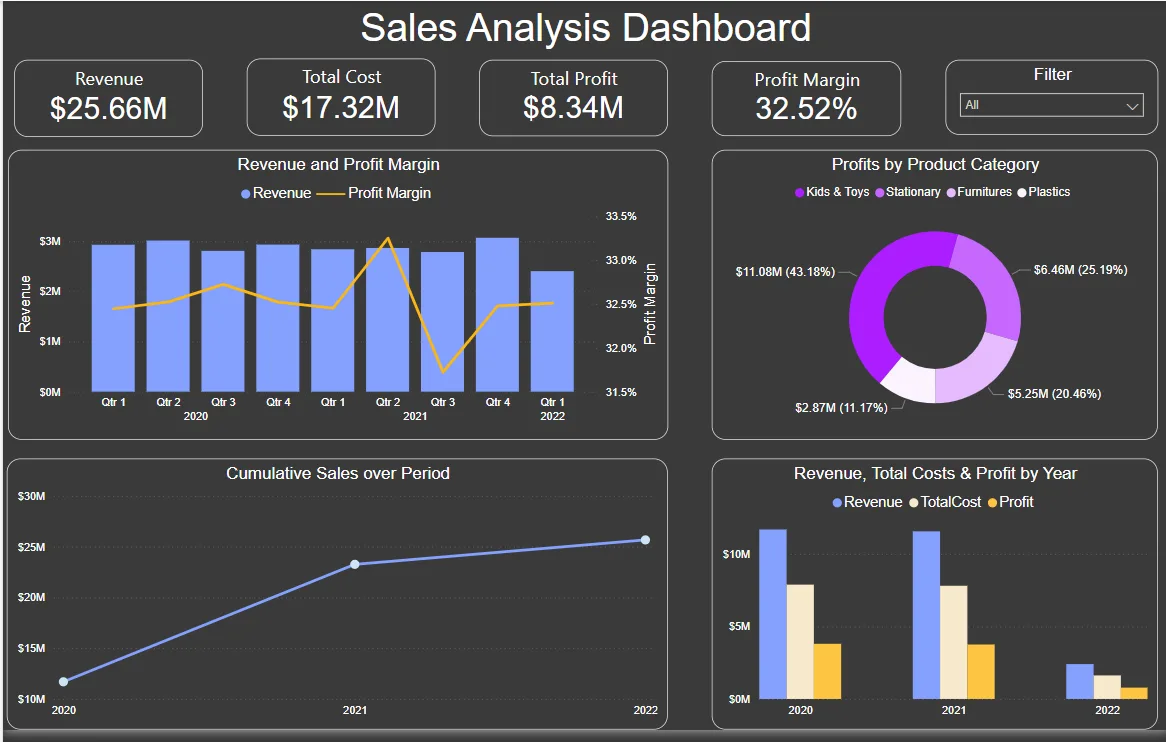
Power BI
$25.66M of revenue by quarter, category and year. Margin stays between 31.7% and 33.3% every quarter, and Kids & Toys is the largest category at 43%.
Repository ↗More, including data engineering exercises and small tools, on GitHub ↗
The credentials that shaped how I work, from degree to today. Most of them earned alongside the job.
I'm open to analytics engineering and data roles, and to freelance pipeline, modelling or dashboard work.